ShmooCon 2013 Talk on fwknop
22 February, 2013
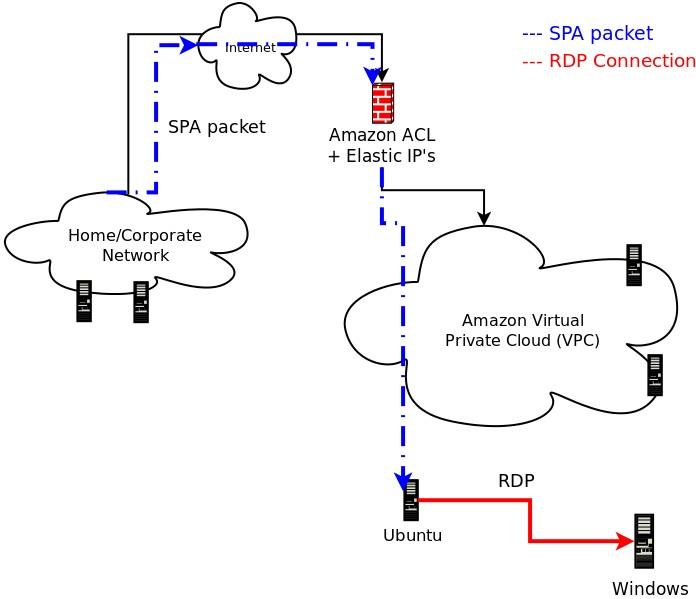
This past weekend at ShmooCon 2013 I gave a talk entitled "Generalized Single Packet Authorization for Cloud Computing Environments" (slides, video demo), and in this blog post I thought it appropriate to give an introduction to the talk in blog format. The main point of the talk was to show that it is completely feasible to integrate SPA as implemented by fwknop with Cloud Computing environments that conform to the Infrastructure as a Service (IaaS) model. In particular, it was shown that SPA can be used to protect and access both SSH and RDP services running on EC2 instances within a Virtual Private Cloud (VPC) in Amazon's AWS environment. Accessing SSHD via SPA by itself is nothing new and has been a primary use case supported by fwknop for a long time, but maintaining a default-drop packet filtering stance for RDP is a different story due to the fact that fwknop does not support a Windows firewall. However, through the use of both SNAT and DNAT capabilities within iptables, the fwknop daemon is able to convert an Ubuntu EC2 instance running within Amazon's Cloud into an "SPA gateway" that is able to then allow access to any service running on any other system within the VPC network - including RDP on a separate Windows host. Further, such access is granted through a single externally routable Amazon Elastic IP that is associated with the Ubuntu system. The Windows host doesn't even need to have a default route back out to the Internet - it always just sees incoming RDP connections from the Ubuntu host even though they really originate out on the Internet from whatever system is allowed via the SPA protocol. Here is a graphic to illustrate this scenario:
 If you want a video demonstration of this all in action, this demo was given during the
ShmooCon talk:
If you want a video demonstration of this all in action, this demo was given during the
ShmooCon talk:
Now, for more explanation, the following systems are depicted in the graphic above:
- The SPA client system that runs the fwknop client to send SPA packets and from which SSH and RDP connections originate.
- The Amazon border firewall.
- An Ubuntu host on the VPC network where the fwknop daemon runs.
- A Windows system on the VPC network where RDP lives.
$ cat ssh_access.sh
#!/bin/sh -x

fwknop -A tcp/80 --server-port 40001 -R -D 107.23.221.41
sleep 2
ssh -p 80 -i ~/.ssh/cdyne-vpc-testing.pem ubuntu@107.23.221.41
exit

$ cat rdp_access.sh
#!/bin/sh -x

fwknop -A tcp/80 --server-port 40001 -N 10.0.0.223,3389 -R -D 107.23.221.41
sleep 2
rdesktop -u Administrator 107.23.221.41:80
exit
To see all of the above in action just watch the video. Hopefully the talk itself will be posted online soon, and when it is I'll post a link. More information can also be found in the talk slides.
Finally, I'd like to thank the ShmooCon organizers for putting on a great conference as usual, and I'm looking forward to next year.

 .
.


